Max. Liquidity & Delta Bias Profile @MaxMaserati 3.0MAX. LIQUIDITY & DELTA BIAS PROFILE @MAXMASERATI 3.0
═══════════════════════════════════════════════════════════════
OVERVIEW
────────
An advanced volume profile tool that analyzes market liquidity and order flow dynamics across different timeframes. This indicator helps traders identify key price levels where significant trading activity and directional bias converge.
DUAL PROFILE SYSTEM
───────────────────
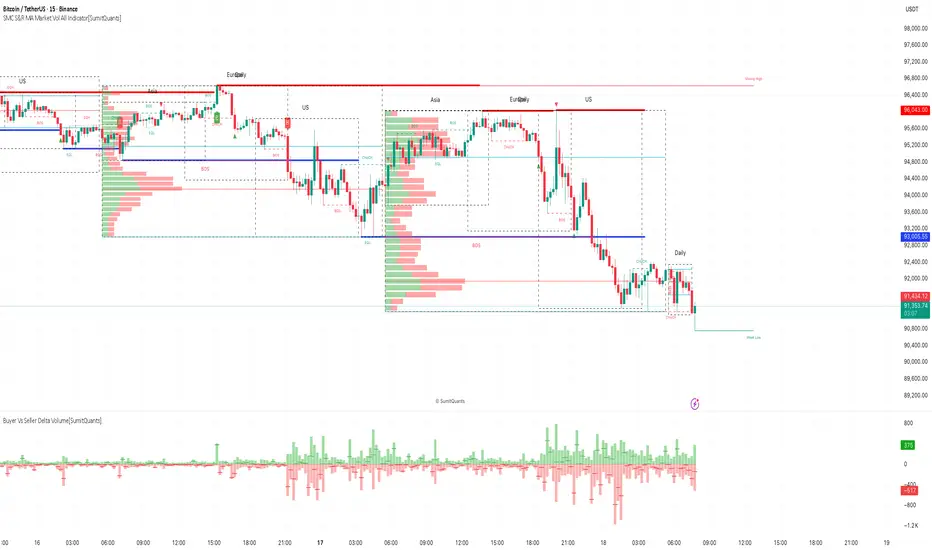
🔷 LIQUIDITY PROFILE (Right Side)
Displays total volume traded at each price level, colored by market bias:
• Green nodes = Bullish dominance (buyers in control)
• Red nodes = Bearish dominance (sellers in control)
• Width represents volume concentration at that level
🔷 DELTA BIAS PROFILE (Left Side)
Shows net buying vs selling pressure at each price level:
• Blue nodes = Positive delta (buying pressure dominates)
• Purple nodes = Negative delta (selling pressure dominates)
• Width represents strength of the imbalance
KEY REFERENCE LEVELS
─────────────
📍 POC (Point of Control)
Yellow horizontal line marking the price with highest traded volume - represents the most accepted fair value during the period.
📍 MAX BULL Level
Green line highlighting the price with strongest bullish conviction - where buyers showed maximum aggression and commitment.
📍 MAX BEAR Level
Red line highlighting the price with strongest bearish conviction - where sellers demonstrated maximum pressure and control.
TOGGLE OFF EVERYTHING EXCEPT THE MAX LINES TO HAVE THIS SETUP
PROFILE STATUS INDICATORS
──────────────────────────
• ▶ ONGOING (Green) = Current developing profile
• ⬛ STOPPED (Red) = Completed profile, new period started
CUSTOMIZATION FEATURES
──────────────────────
✓ Multiple anchor periods (Auto/Session/Day/Week/Month/Quarter/Year)
✓ Independent toggles for each visual element
✓ Individual color and size controls for every label
✓ Adjustable profile width and transparency
✓ Customizable line widths and styles
TRADING APPLICATIONS
────────────────────
• Identify high-probability support/resistance zones
• Spot institutional accumulation/distribution levels
• Detect order flow imbalances before major moves
• Track intraday value areas and fair price zones
• Confirm trend strength through delta analysis
• Find optimal entry/exit levels based on volume
WHO THIS IS FOR
───────────────
Designed for active traders who:
• Trade futures, stocks, forex with volume data
• Use volume profile and market profile concepts
• Analyze order flow and institutional footprints
• Seek data-driven price level identification
• Want visual clarity on market structure
NOTES
─────
• Requires volume data to function properly
• Best used on liquid instruments with consistent volume
• Profiles reset based on selected anchor period
• All visual elements can be toggled independently
• Performance optimized for real-time analysis
⚠️ DISCLAIMER
Educational Tool Only - This indicator is for educational and informational purposes only and does not constitute financial, investment, or trading advice.
Risk Warning - Trading involves substantial risk of loss and is not suitable for all investors. Past performance does not guarantee future results. No representation is made that this indicator will achieve profits or prevent losses.
User Responsibility - All trading decisions are solely your responsibility. The developer and Max Maserati Model assume no liability for losses incurred from using this indicator. Conduct your own research and consult a qualified financial advisor before making investment decisions.
Data Dependency - Indicator accuracy depends on your TradingView plan's data availability and selected timeframe support.
By using this indicator, you acknowledge and agree to these terms.
Индикатор Pine Script®